Assignment No.1 (Course STA301)
Fall 2011 (Total Marks 30)
Deadline
Your Assignment must be uploaded/ submitted before or on28th Oct, 2011STUDENTS ARE STRICTLY DIRECTED TO SUBMIT THEIR ASSIGNMENT BEFORE OR BY DUE DATE. NO ASSIGNMNENT AFTER DUE DATE WILL BE ACCEPTED VIA E.MAIL).
Rules for Marking
It should be clear that your Assignment will not get any credit IF:
· The Assignment submitted, via email, after due date.
· The submitted Assignment is not found as MS Word document file.
· There will be unnecessary, extra or irrelevant material.
· The Statistical notations/symbols are not well-written i.e., without using MathType software.
· The Assignment will be copied from handouts, internet or from any other student’s file. Copied material (from handouts, any book or by any website) will be awarded ZERO MARKS. It isPLAGIARISM and an Academic Crime.
· The medium of the course is English. Assignment in Urdu or Roman languages will not be accepted.
· Assignment means Comprehensive yet precise accurate details about the given topic quoting different sources (books/articles/websites etc.). Do not rely only on handouts. You can take data/information from different authentic sources (like books, magazines, website etc) BUT express/organize all the collected material inYOUR OWN WORDS. Only then you will get good marks.
Objective(s) of this Assignment:
· The assignment is being uploaded to strengthen the students’ BASIC concepts about statistics.
· Practice for arranging and displaying already collected data into an organized form, using given statistical method.
· Make students able to understand the concept of measures of central tendency.
Assignment.1 (Lessons 1-10)
Question 1:Marks: 5+5=10
i) From the table given below, Find
(a) Class boundaries
(b) How many men fall in the age of 50 or above?
(c) How many men fall between the age group of 60 and 69?
Age Group (Men) | f |
20-29 | 5 |
30-39 | 4 |
40-49 | 5 |
50-59 | 8 |
60-69 | 12 |
70-79 | 16 |
Total | 50 |
(ii) Write down the following figure in the form of frequency table and also find the relative frequency.
Question 2:Marks: 5+5=10
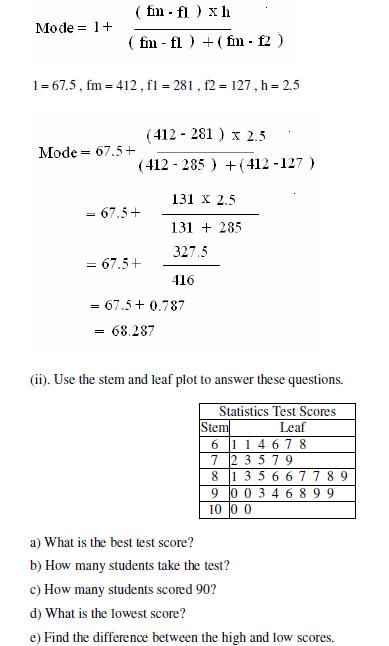
(i) Calculate the mode from the following continuous distribution.
Height | Number (f) |
57.5-60.0 | 6 |
60.0-62.5 | 26 |
62.5-65.0 | 190 |
65.0-67.5 | 281 |
67.5-70.0 | 412 |
70.0-72.5 | 127 |
72.5-75.0 | 38 |
Total | 1080 |
(ii). Use the stem and leaf plot to answer these questions.
Statistics Test Scores | |
Stem | Leaf |
6 | 1 1 4 6 7 8 |
7 | 2 3 5 7 9 |
8 | 1 3 5 6 6 7 7 8 9 |
9 | 0 0 3 4 6 8 9 9 |
10 | 0 0 |
a) What is the best test score?
b) How many students take the test?
c) How many students scored 90?
d) What is the lowest score?
e) Find the difference between the high and low scores.
Question 3:Marks: 3+3+4=10(i) Find the median for the following discrete frequency distribution.
Number of pupils per class | Number of Classes |
20 | 1 |
21 | 0 |
22 | 1 |
23 | 3 |
24 | 6 |
25 | 9 |
26 | 8 |
27 | 10 |
28 | 7 |
Total | 45 |
(ii) Calculate the weighted mean from the following data
Item | Expenditure | Weights |
Food | 290 | 7.5 |
Rent | 54 | 2.0 |
Clothing | 98 | 1.5 |
Fuel and light | 75 | 1.0 |
Other items | 75 | 0.5 |
(iii) A man gets a rise of 10% in salary at the end of his first year of service and further of 20 % and 25 % at the end of the second and third year respectively. The rise in each case is calculated on his salary at the beginning of the year. To what annual percentage increase is this equivalent?
Solution:
Class Boundaries f
19.5-29.5 5
29.5-39.5 4
39.5-49.5 5
49.5-59.5 8
59.5-69.5 12
59.5-79.5 16
total 50
(b) How many men fall in the age of 50 or above?
Men above 50
= 8+12+16=36
(c) men fall between the age group of 60 and 69=
=12
(ii) Write down the following figure in the form of frequency table and also find the relative frequency.
Class Boundaries f Relative frequncy
19.5-29.5 5 5/50=0.1
29.5-39.5 4 4/50=0.08
39.5-49.5 5 5/50=0.1
49.5-59.5 8 8/50=
59.5-69.5 12 12/5=
59.5-79.5 16 16/50=
total 50
Question 2:Marks: 5+5=10
(i) Calculate the mode from the following continuous distribution.
Height Number (f)
57.5-60.0 6
60.0-62.5 26
62.5-65.0 190
65.0-67.5 281----f1
l--67.5-70.0 412---model class
70.0-72.5 127-----f2
72.5-75.0 38
Total 1080
Ans=
Mode = l + fm-f1/(fm-f1)+(fm-f2) * h
Fm = frequency of model class = highest frequency =412
H= difference between class boundries = 2.5
So…
Mode= 67.5+412-281/(412-281)+(412-127)*2.5
= 67.5+131/(131)+(285)*2.5
= 68.287
(ii). Use the stem and leaf plot to answer these questions.
Statistics Test Scores
Stem Leaf
6 1 1 4 6 7 8
7 2 3 5 7 9
8 1 3 5 6 6 7 7 8 9
9 0 0 3 4 6 8 9 9
10 0 0
a) What is the best test score?
Ans best score 100
b) How many students take the test?
Ans 30students
c) How many students scored 90?
Ans 02students made 90
d) What is the lowest score?
Ans lowest score= 61
e) Find the difference between the high and low scores.
Ans high score = 100
Lowest = 61
Difference = 100- 61 =59
Question 3:Marks: 3+3+4=10(i) Find the median for the following discrete frequency distribution.Number of pupils per class Number of Classes
F cf
20 1 1
21 0 1
22 1 2
23 3 5
24 6 11
25 9 20
26 8 28
27 10 38
28 7 45
Total 45
Median=n+1/2 for more detail page no61 of HO
45+1/2
median =23rd value is lying in 26the distribution so median = 26
(ii) Calculate the weighted mean from the following dataItem Expenditure Weights
Food 290 7.5
Rent 54 2.0
Clothing 98 1.5
Fuel and light 75 1.0 solve from page no58 of HO
Other items 75 0.5
(iii) A man gets a rise of 10% in salary at the end of his first year of service and further of 20 % and 25 % at the end of the second and third year respectively. The rise in each case is calculated on his salary at the beginning of the year. To what annual percentage increase is this equivalent?
Ans
Annual percentage increase in his salary = 10%+20%+25%/3
= 55/3
= 18.33%


another solution: STA301 solution


 Fall 2011 (Total Marks 30) Deadline Your Assignment must be uploaded/ submitted before or on28 th Oct, 201...)
0 comments
Post a Comment